TradingView charts are now part of Deriv X, bringing you a sleek, powerful way to analyse the markets. If you're wondering how to get started or why this is a game-changer, we’ve got you covered.
What’s TradingView?
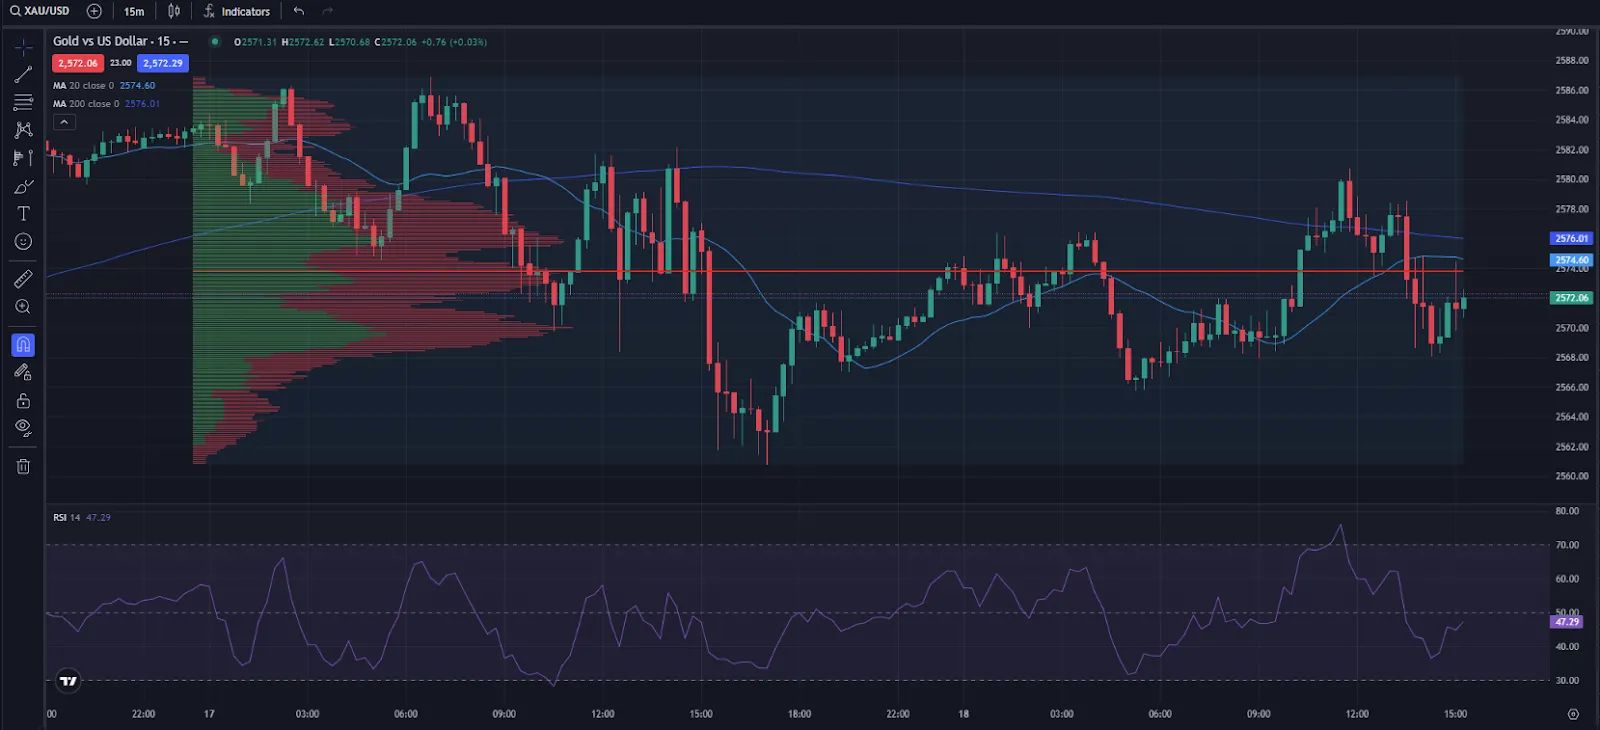
Think of TradingView as your ultimate charting sidekick. It’s a top-tier platform used by over 90 million traders worldwide. With customisable layouts, smart technical indicators, heatmaps, stock screeners, and an economic calendar, it’s like having a personal chart analyst at your fingertips.
What’s new on Deriv X?
With TradingView integrated into Deriv X, you get access to a variety of markets, from forex and stocks to commodities, crypto, ETFs, and our exclusive Derived Indices. Here’s what makes it awesome:
- Drawing tools. Over 110 tools to sketch out trend lines, Fibonacci retracements, and more. Your charts are now more interactive and precise.
- Technical indicators: Over 100 built-in indicators to help you catch trends before they happen.
- Multi-chart layouts. Watch multiple charts at once, track different assets, and customise your setup like a pro.


How to use TradingView on Deriv X
Getting started is a breeze:
- Log in or sign up. No account? No problem! Just create one from the Trader's Hub.
- Open Deriv X. Your gateway to the TradingView experience.
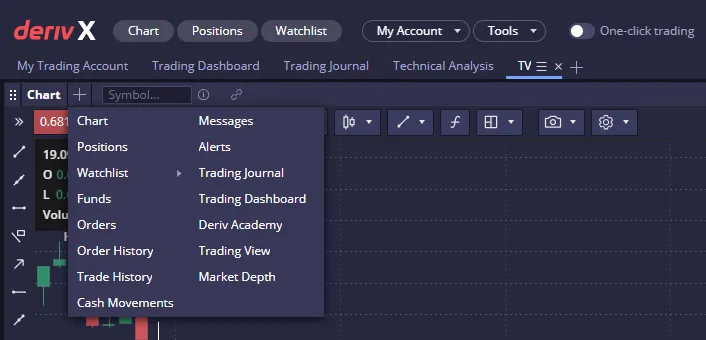
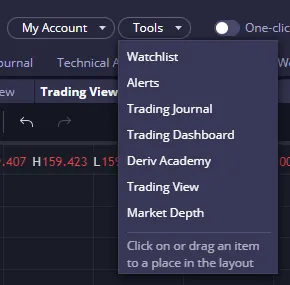
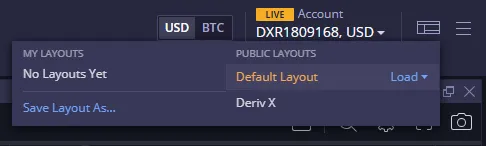
- Launch TradingView charts. Click the + icon, go to Tools and select TradingView, or load the Default layout.
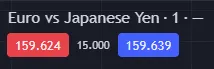
- Pick an asset. Scroll through the watchlist and choose what you want to trade.

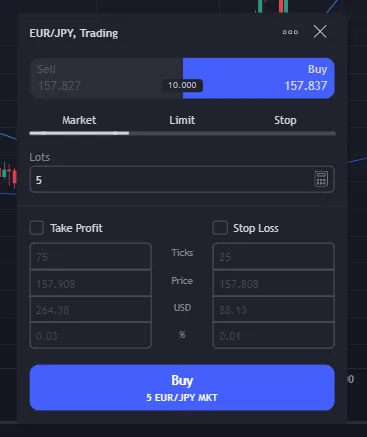
- Make your move. Choose red to sell or blue to buy. Clear and simple.
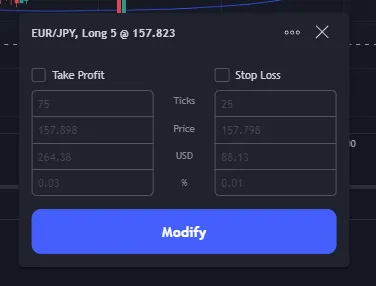
- Fine-tune your trade. Set stop loss, take profit, and choose market, limit, or stop orders.
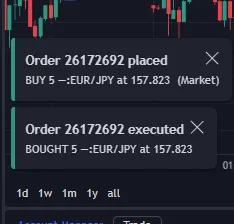
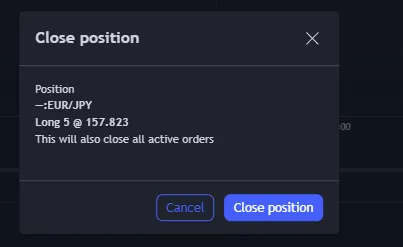
- Keep an eye on things. Track your open trades in the Positions tab and adjust as needed.
Ready to trade smarter? Try TradingView on Deriv X.
TradingView charts make your trading experience smoother, smarter, and more flexible. Explore it risk-free with a demo account and see for yourself!
Quiz
What’s one key advantage of TradingView charts on Deriv X?
FAQs


Trade with confidence


